
The continental shelves that were dry land when the sea stood lower
Drowned Lands
Dry land until the seas rose after the last glacial maximum (about 120 metres lower, and a seafloor still mostly unmapped)

At the coldest stretch of the last ice age the sea stood on the order of 120 metres lower than it does today. The continental shelves were country. Rivers ran where the charts now print soundings. People hunted, fished, and, in a few places we have actually opened, built in stone. Then the ice gave the water back, and those countries went under.
This page does not pretend one shoreline fits every ocean. On the Sunda Shelf a published curve puts the glacial sea near 116 metres down, and then a rise of as much as 16 metres inside about 300 years. Other shelves are shallower, so they drowned later, or deeper, so they drowned sooner. The seven pins are the seven places. This page is where they sit together, and where the gap they share is easiest to see.
Why this is extraordinary
How little of that country has been walked is the shared fact. The Nippon Foundation–GEBCO Seabed 2030 project is a bathymetric effort, a campaign to put a modern depth on the whole ocean floor and to publish it in the free GEBCO grid. A project history records that about 6 percent of the ocean floor had been mapped to the project’s modern standard when the work began in 2017. On 21 June 2024 the project announced 26.1 percent, after 4.34 million square kilometres of new data in that year, an area it compared to the European Union. On 21 June 2025 it announced 27.3 percent, after more than 4 million square kilometres in the twelve months before, an area it compared to the Indian subcontinent. Those percentages are the whole ocean, deep basins included. A depth in a grid cell is not a house. Navigation charts of a shallow shelf can be old and still say nothing about a hearth.
The map at the top of this page is one licensed picture of the change, and it is Europe only. Ice in white, and land now under the sea drawn back in, for the last glacial maximum. It is not a survey of the Java Sea or the Gulf, and it is not the planet. A global coastline of the same kind, with a licence this museum can show unedited, was not the picture used here. Each room carries the map that belongs to its own water.
The lanes do not read the gap the same way. Doggerland has the bones and the tools, and a dated wave, and almost no excavated camp. Sundaland has a measured flood of a huge shelf, and the question of whether the people moved with the water. The Sahul shelf has the first confirmed underwater Aboriginal sites in Australia, in water that is still shallow, and a much older arrival on the land that never drowned. Beringia has a genetic and environmental case for a long stay on the bridge, and almost no archaeology from the part that is now sea. The Persian Gulf basin has a published oasis reading, rivers on a dry floor, and shoreline towns that appear as the floor goes under. Atlit Yam is the rare one: a whole Neolithic village, wells and burials and a stone circle, already dug. Florida has a dated mastodon hunt in a sinkhole that the rising sea later covered, and a separate string of sites on the Gulf shelf a few kilometres out.
A sky reading, where a coast has one, lives in that room. Several of these shelves have no azimuth at all, because the wall it would be measured on is still under the sand.
The rooms
Each of these is its own pin, set where that place is. This page gathers them.
-
 Doggerland Doggerland is a lost country under the North Sea, where people hunted and fished until the water took it island by island.
-
 Sundaland The low sea that joined Sumatra, Java, and Borneo, and the shore that is only a contour.
-
 Sahul shelf The shelf that joined Australia to New Guinea, with the first confirmed underwater Aboriginal sites in shallow water off Murujuga, and a much older arrival on the land that stayed dry.
-
 Beringia The plain between Siberia and Alaska, dry whenever the sea fell below a shallow strait, with a genetic case for a long human stay and almost no archaeology from the part that drowned.
-
 Persian Gulf basin A shallow basin the Tigris and Euphrates once crossed in the air, read as a fertile refuge in dry millennia, and still without an excavated village on the seabed.
-
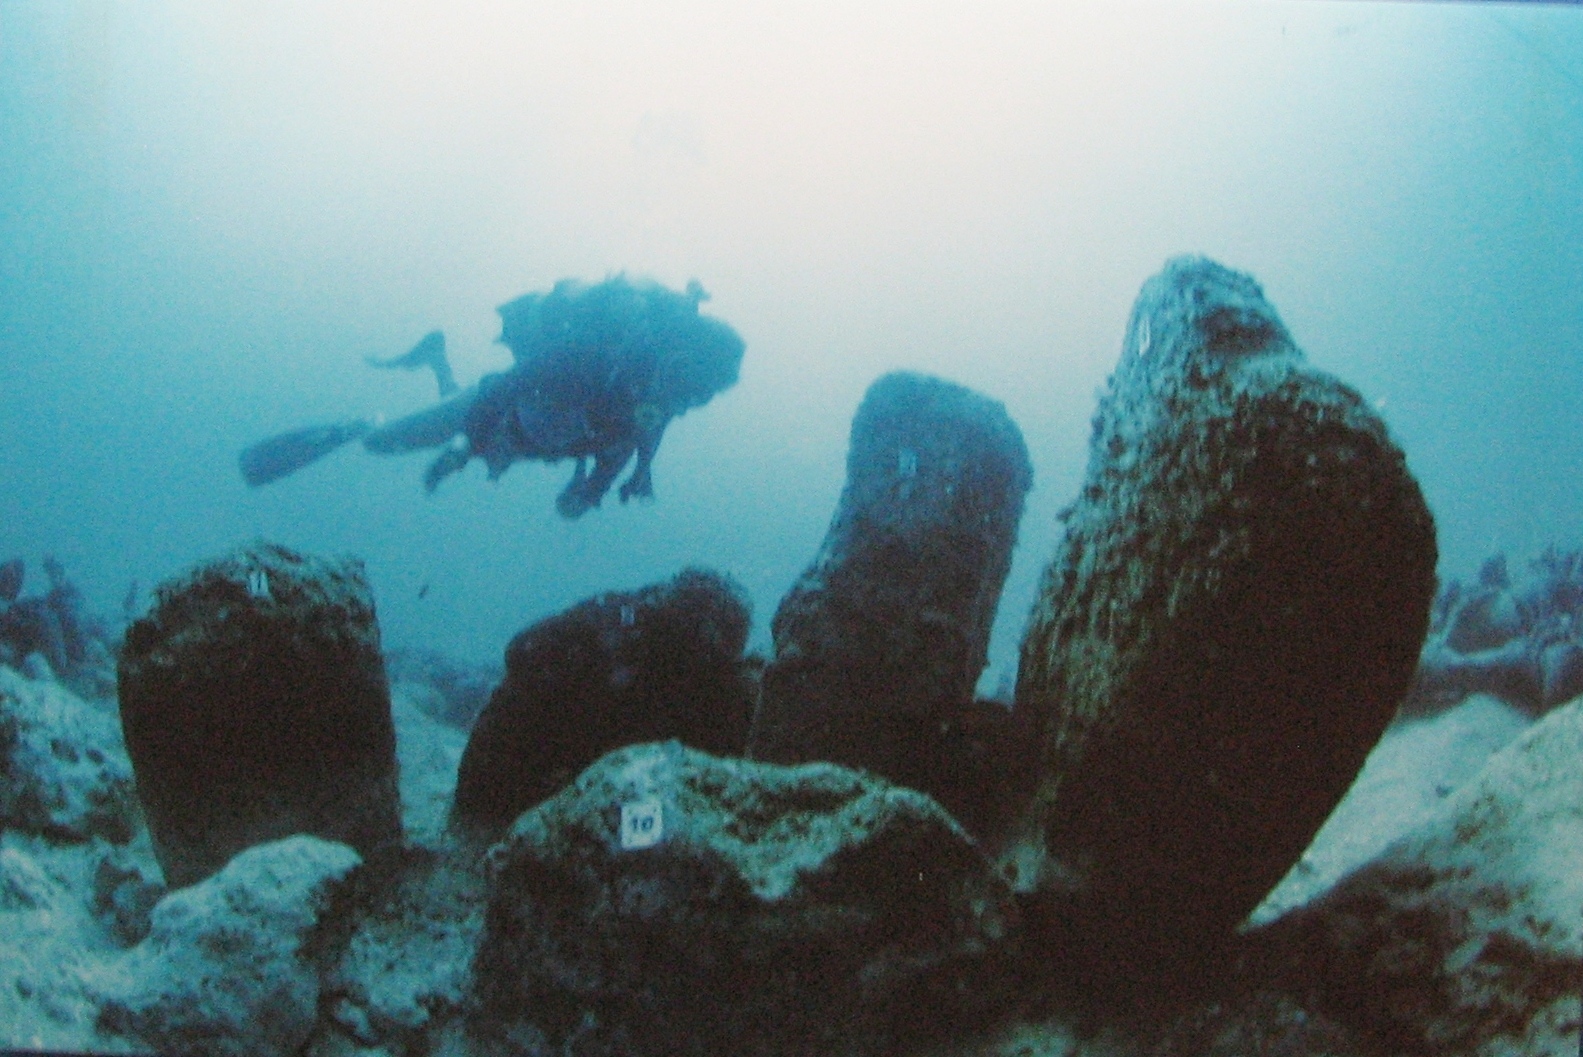 Atlit Yam A stone-built Neolithic village 200 to 400 metres off the Carmel coast, with wells, burials, and a circle of standing stones, excavated on the seabed.
-
 Florida drowned sites A mastodon butchery about 14,550 years ago in a Florida sinkhole the sea later drowned, and a string of older camps on the Gulf shelf a few kilometres out.